 Tweet
Tweet
A Tale of Non-Linear Inductance and Electrical Oscillations
Introduction
After spending an inordinate amount of time in contemplation and experimentation, I am now unsure if this circuit arrangement actually exhibited the 2nd harmonic mode of parametric excitation!
Experimentally determined, the inductance change is at the same frequency as the electrical oscillation created during operation. The resultant ratio of rotations seen is 1M:2P:2E. This said another way, 360� Mechanical to 720� Parameter to 720� Electrical. This is not something I would have expected.
This result precludes the 2nd harmonic mode of operation, something I found quite confusing. However, the analysis of the "rate of change" may need to be re-examined, it could be that a "hi to low" or a "low to hi" transition is a full cycle for parametric change, however, each transition would be the equivalent of a half cycle for a common sinusoid. Curiously, a total of four transition cycles, 2x "hi-low" and 2x "low-hi", are seen in this circuit, but this is totally different from a 2xf step or sinusoidal variation which is assumed or explicitly implied in most explanations on the subject.
*Update
I've done some graphing and further examination of this experiment, and have come to the conclusion that another mode of natural excitation exists, in which the parameter is changed at the same frequency as the electrical oscillation! This mode hasn't been described by any text I have found regarding the subject (but may have slipped passed my notice), therefore, I believe this is "new territory" for parametric systems. Which now provides a new mode of operation for which we can build with. This 1P:1E mode of excitation exhibits almost all the qualities of the "2nd harmonic" 2P:1E mode generally described by the usual references. There isn't too much that needs explanation from me, other than this has been experimentally verified on the bench.
Analysis of Collected Data
Here's an approximate view of the reluctance motor's magnetic circuit, I sketched this up in CAD, its close but not exactly the same as what I am using.

It can be seen, that if we rotate the rotor we will change the length and area of the magnetic path. For the variable value of inductance, this means we can only have two positions of maxima and two of minima respectively at 90� to one another and 180� to themselves. We also get four positions that equal the average value of inductance, the angle for this, however, isn't so clear from looking.
Thus far, we can conclude that there are a total of eight positions that are of interest, and in need of having the angle between each determined before further understanding can take place.
The simplest method I could come up with was to rotate the rotor and use my LCR meter to measure the inductance at different positions to find the eight specific points listed earlier. When found, I then marked them on my timing wheel and once finished, I then removed the timing wheel to transfer the marks to a piece of paper for measurement with a protractor. I will admit that this wasn't the most accurate solution, but it was simple and effective. To ensure accuracy, I did this process 3 times and took the average of all three measurements and threw out any results that weren't in agreement with the others.
Here's a close up of the timing wheel, the marks I plotted for finding the angles are on the other side of the disk.

Experimentally determined, the angles between the points of interest were found as follows;
Minima to Average, 36� (�1� measurement error)
Maxima to Average, 54� (�4� measurement error)
Minima to Maxima, 90� (�0� measurement error)
Total Half Period, Rise to Fall:
Minima, Average to Average, 72�
Maxima, Average to Average, 108�
Here's a more visual friendly look at the angles with the timing wheel used as a reference.

Tech Note, the value for Maxima didn't change appreciably for up to �4� or a total of 8� of rotation, this was confirmed by the three different experimental plots taken for measurement. It makes sense though, when in the position of minimum reluctance, the rate of change seen is very very small as opposed to near the Average (or "zero-crossing") or Minima (has a shorter period) values, which have higher rates of change per degree of rotation.
We can illustrate these results in a more useful manner as a graph showing the inductance magnitude per degree of mechanical rotation. But first, we must take the results into ratios for use when making the inductance plot.
If we examine a mechanical half-rotation, 180�, and use the assumption of sinusoidal change for inductance, we find that the device exerts a full 360� parameter rotation, seen as 1x minima, rise to fall and 1x maxima, rise to fall of parameter change half-periods, per one half-rotation mechanical, we can now express the the ratio of the maxima and minima half-periods in mechanical degrees per mechanical half-rotation as:
Minima half-period (in mechanical degrees) per mechanical half-rotation (in degrees), 72�/180� = 0.4
Maxima half-period (in mechanical degrees) per mechanical half-rotation (in degrees), 108�/180� = 0.6
Tech Note, these ratios can be used to find the correct half-period for the respective minima and maxima sinusoids used in constructing the plot. If the inductance change per degree mechanical for the maxima and minima were equal, we wouldn't need to do this.
These ratios help us in understanding what is going on during the mechanical movement of the rotor and will be used later with the examination of another set of ratios derived from the electrical oscillation. These ratios tell us how much time the inductance parameter is low and high respectively per each parameter full-cycle or mechanical half-cycle.
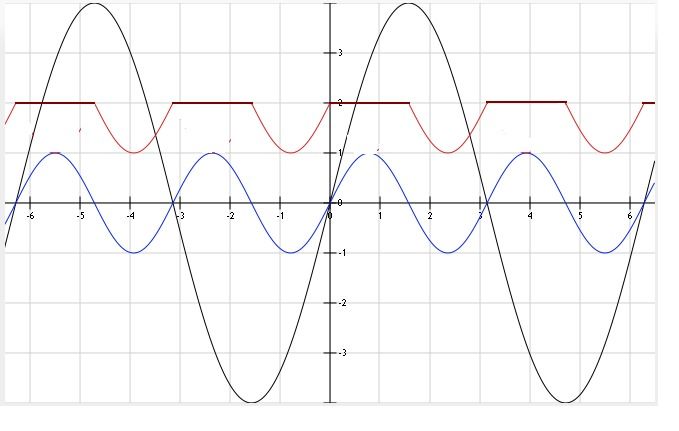
Given below, is the diagrammatic view of the modulated inductance per degree of mechanical rotation, this is the culmination of our earlier measurements and calculations. Note that the respective storage parameter angular relationships are not listed, these will have use later with reference to the electrical oscillation.

More to be added latter.
Garrett M
Introduction
After spending an inordinate amount of time in contemplation and experimentation, I am now unsure if this circuit arrangement actually exhibited the 2nd harmonic mode of parametric excitation!
Experimentally determined, the inductance change is at the same frequency as the electrical oscillation created during operation. The resultant ratio of rotations seen is 1M:2P:2E. This said another way, 360� Mechanical to 720� Parameter to 720� Electrical. This is not something I would have expected.
This result precludes the 2nd harmonic mode of operation, something I found quite confusing. However, the analysis of the "rate of change" may need to be re-examined, it could be that a "hi to low" or a "low to hi" transition is a full cycle for parametric change, however, each transition would be the equivalent of a half cycle for a common sinusoid. Curiously, a total of four transition cycles, 2x "hi-low" and 2x "low-hi", are seen in this circuit, but this is totally different from a 2xf step or sinusoidal variation which is assumed or explicitly implied in most explanations on the subject.
*Update
I've done some graphing and further examination of this experiment, and have come to the conclusion that another mode of natural excitation exists, in which the parameter is changed at the same frequency as the electrical oscillation! This mode hasn't been described by any text I have found regarding the subject (but may have slipped passed my notice), therefore, I believe this is "new territory" for parametric systems. Which now provides a new mode of operation for which we can build with. This 1P:1E mode of excitation exhibits almost all the qualities of the "2nd harmonic" 2P:1E mode generally described by the usual references. There isn't too much that needs explanation from me, other than this has been experimentally verified on the bench.
Analysis of Collected Data
Here's an approximate view of the reluctance motor's magnetic circuit, I sketched this up in CAD, its close but not exactly the same as what I am using.
It can be seen, that if we rotate the rotor we will change the length and area of the magnetic path. For the variable value of inductance, this means we can only have two positions of maxima and two of minima respectively at 90� to one another and 180� to themselves. We also get four positions that equal the average value of inductance, the angle for this, however, isn't so clear from looking.
Thus far, we can conclude that there are a total of eight positions that are of interest, and in need of having the angle between each determined before further understanding can take place.
The simplest method I could come up with was to rotate the rotor and use my LCR meter to measure the inductance at different positions to find the eight specific points listed earlier. When found, I then marked them on my timing wheel and once finished, I then removed the timing wheel to transfer the marks to a piece of paper for measurement with a protractor. I will admit that this wasn't the most accurate solution, but it was simple and effective. To ensure accuracy, I did this process 3 times and took the average of all three measurements and threw out any results that weren't in agreement with the others.
Here's a close up of the timing wheel, the marks I plotted for finding the angles are on the other side of the disk.
Experimentally determined, the angles between the points of interest were found as follows;
Minima to Average, 36� (�1� measurement error)
Maxima to Average, 54� (�4� measurement error)
Minima to Maxima, 90� (�0� measurement error)
Total Half Period, Rise to Fall:
Minima, Average to Average, 72�
Maxima, Average to Average, 108�
Here's a more visual friendly look at the angles with the timing wheel used as a reference.
Tech Note, the value for Maxima didn't change appreciably for up to �4� or a total of 8� of rotation, this was confirmed by the three different experimental plots taken for measurement. It makes sense though, when in the position of minimum reluctance, the rate of change seen is very very small as opposed to near the Average (or "zero-crossing") or Minima (has a shorter period) values, which have higher rates of change per degree of rotation.
We can illustrate these results in a more useful manner as a graph showing the inductance magnitude per degree of mechanical rotation. But first, we must take the results into ratios for use when making the inductance plot.
If we examine a mechanical half-rotation, 180�, and use the assumption of sinusoidal change for inductance, we find that the device exerts a full 360� parameter rotation, seen as 1x minima, rise to fall and 1x maxima, rise to fall of parameter change half-periods, per one half-rotation mechanical, we can now express the the ratio of the maxima and minima half-periods in mechanical degrees per mechanical half-rotation as:
Minima half-period (in mechanical degrees) per mechanical half-rotation (in degrees), 72�/180� = 0.4
Maxima half-period (in mechanical degrees) per mechanical half-rotation (in degrees), 108�/180� = 0.6
Tech Note, these ratios can be used to find the correct half-period for the respective minima and maxima sinusoids used in constructing the plot. If the inductance change per degree mechanical for the maxima and minima were equal, we wouldn't need to do this.
These ratios help us in understanding what is going on during the mechanical movement of the rotor and will be used later with the examination of another set of ratios derived from the electrical oscillation. These ratios tell us how much time the inductance parameter is low and high respectively per each parameter full-cycle or mechanical half-cycle.
Given below, is the diagrammatic view of the modulated inductance per degree of mechanical rotation, this is the culmination of our earlier measurements and calculations. Note that the respective storage parameter angular relationships are not listed, these will have use later with reference to the electrical oscillation.
More to be added latter.
Garrett M


Comment