Announcement

Collapse
No announcement yet.

COP 17 Heater | Rosemary Ainslie

Collapse
This topic is closed.
X
This is a sticky topic.
X
X
 
  • Filter
  • Time
  • Show
Clear All
new posts

  • FuzzyTomCat
    replied
    Hi everyone,

    Thanks to Rosemary, Aaron and Mark for your encouragement on this build, and I think mine is working now .....

    These shots are from my Tektronix 2445A 150 MHz scope (4-channel) taken from the probe positions battery ground and between the IRFPG50 (D-drain) and 10 ohm resistor.


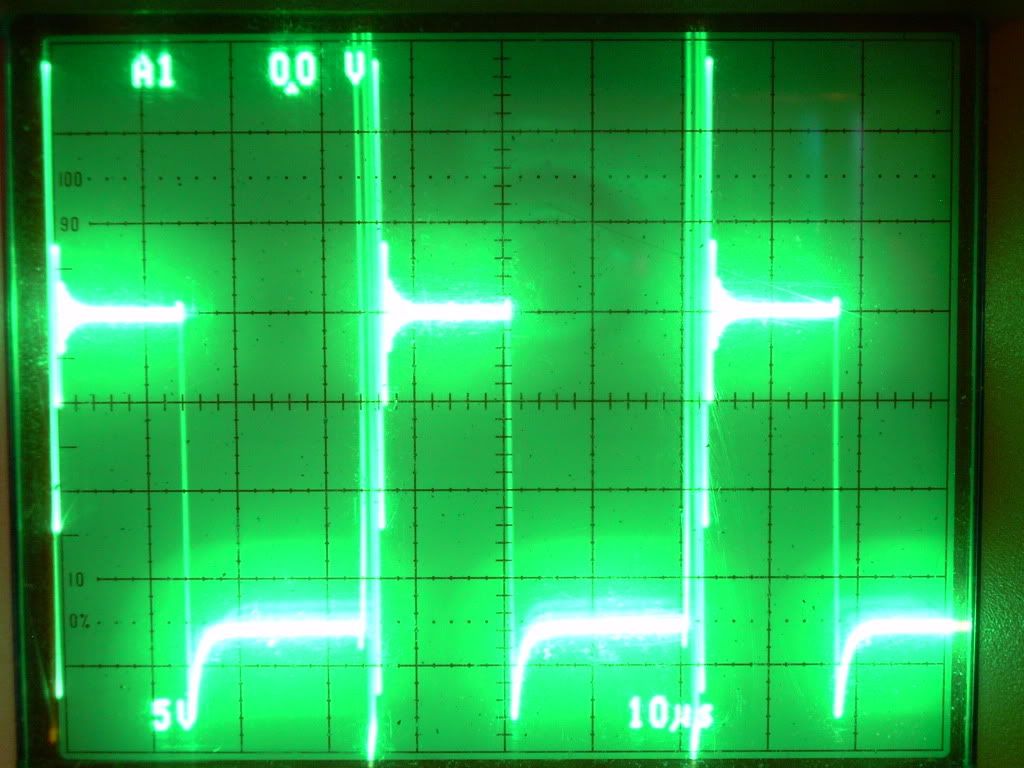
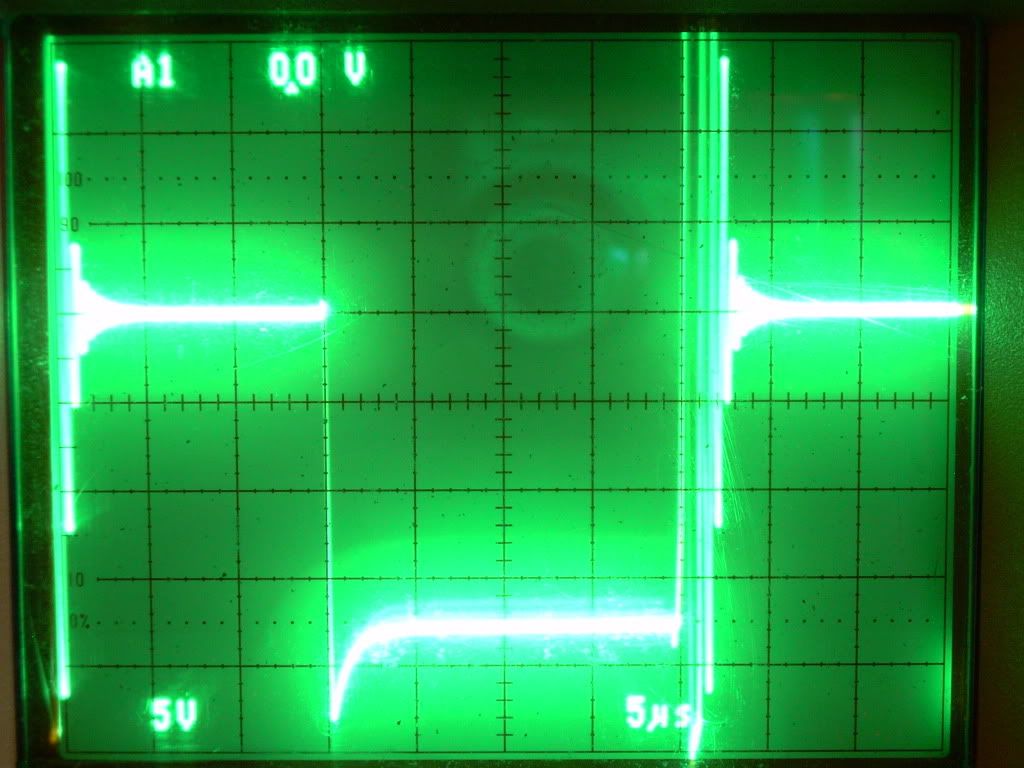
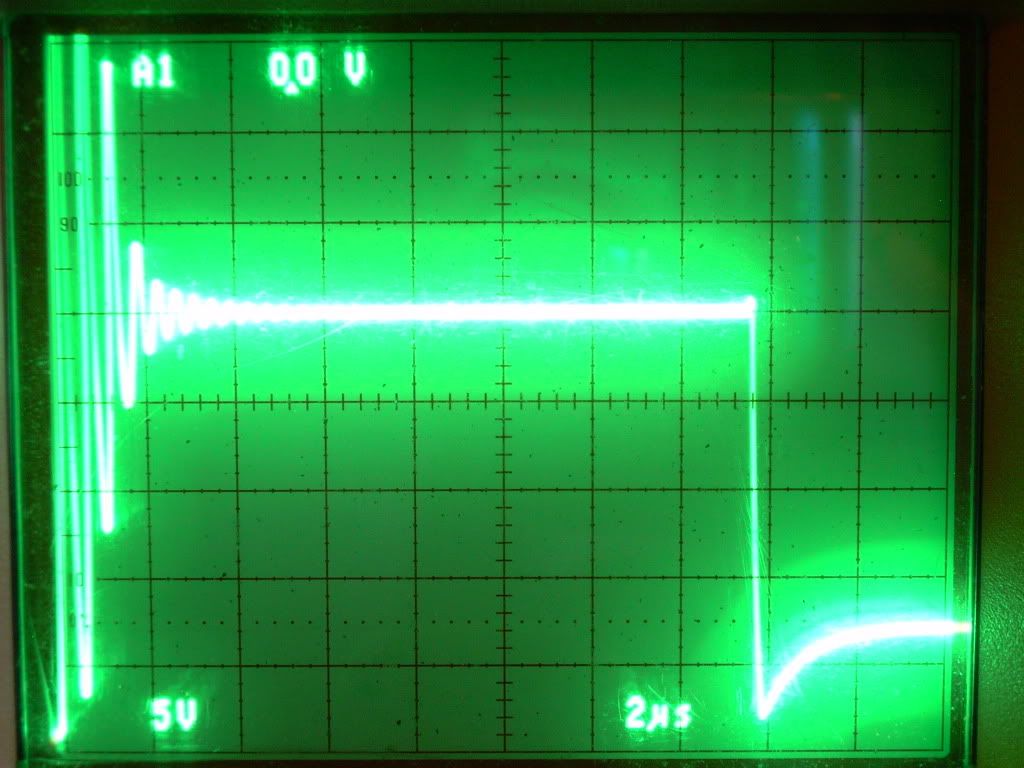
    Now all we need is the where the scope probes actually go for final adjustments and documentation with the test protocol ....... I need to get my temperature sensor because the 10 ohm resistor got pretty warm.

    Best Regards,
    Glen

    Leave a comment:


  • Aaron
    replied
    temps

    Originally posted by poynt99 View Post
    Aaron,

    What was the baseline temperatures of the shunt and load resistors? i.e. the temps with no power applied?

    They will no doubt be several degrees below ambient.

    .99
    The ambient was determined by having the ambient probe INSIDE ANOTHER INDUCTIVE RESISTOR that has no power going to it and the ambient probe was left in that power free inductive resistor through the ENTIRE test. This comparison is ACCURATE.

    The shunt and load resistor were at AMBIENT before running. And again, the ambient used as a reference is INSIDE ANOTHER inductive resistor that has no power going to it and is sitting on the same temperature as the load resistor.

    They are UNDOUBTEDLY the SAME temperature as ambient, when not running. Your condition of a required below ambient temperature is false.
    Last edited by Aaron; 08-28-2009, 04:29 AM.

    Leave a comment:


  • Aaron
    replied
    @poynt

    Originally posted by poynt99 View Post
    The "below zero" analysis is not necessarily correct. The load wave form is with the probes across the load as you stated, not with any reference to ground. Measurements need to be made to the same reference as the battery to know direction of the current.

    .99
    You are misdirecting people's attention away from the FACT that the data posted is of the SHUNT, which IS PROPERLY REFERENCED TO THE TIMER SHUNT AND BATTERY.

    It is a perfect power analysis done in the manner in which strict academic analysis accepts. Your opinion to the contrary is noted.

    I posted no data on the load as the load data is irrelevant to showing the GAIN - as the shunt is all that is necessary to show the point of power draw according to YOUR conventional protocols.

    The fact that you are ignoring this common sense shows me that you have no sincerity if your questions and are simply distracting people from facts. Very, very rude.

    I would expect from you some questions that don't insult my intelligence or anyone else's here.

    Leave a comment:


  • poynt99
    replied
    Your 555 timer is running at about 431kHz.

    The 5MHz showing on the 0.25 Ohm timer shunt is just noise. It's doubtful there is any real 5MHz component anywhere in the circuit wave forms.

    The "below zero" analysis is not necessarily correct. The load wave form is with the probes across the load as you stated, not with any reference to ground. Measurements need to be made to the same reference as the battery to know direction of the current.

    .99

    Leave a comment:


  • poynt99
    replied
    Aaron,

    What was the baseline temperatures of the shunt and load resistors? i.e. the temps with no power applied?

    They will no doubt be several degrees below ambient.

    .99
    Last edited by poynt99; 08-28-2009, 03:32 AM.

    Leave a comment:


  • Aaron
    replied
    Thanks Rosemary!

    Thanks Rosemary! I couldn't have done it without all your support and encouragement. This has been an incredible learning and growth experience.

    The effect shown is very real and measurable...even the cooling effect - measurable.

    The cooling is negative energy from the active vacuum moving into the circuit. It is a converging, cooling, collective energy instead of dissipating, warning and scattering energy. If the circuit is biased to the negative, there will not be equilibrium, it will be weighed in the favor of negative energy and the cooling is indicative of this.

    There are other tests that I hope to share as I've recorded many tests. I focused on showing this one because showing the negative value with cooling simply adds insult to injury in a very big way to electron current theory. In any case, this has been a great learning experience.

    For everyone - it is all in the tuning. The schematic I posted works and use the right kind of tuning pots that I showed or similar in quality. You really want precision.

    Leave a comment:


  • Aaron
    replied
    comments

    @Joit, thanks, the heat may be what Harvey is talking about. In any case, it is heat when the total circuit draw is negative

    @Ash, yes, my thoughts are that electron current theory has always been wrong for obvious reasons, but in either case, the data here speaks for itself in my opinion but is open to interpretation.

    @Harvey, if I have time later tonight, I'll post a spreadsheet and photo of the waveform for multiple waveforms. I still get negative values for net draw. And I believe the cooling up to 1C below ambient of the load and load shunt indicate that the negative wattage draw are accurate and would be consistent with my own model of reality. Anyway, I'll post later.

    @everyone, what I have shown as far as the Detailed Integrated Power Analysis, needs to become the new standard for analyzing these circuits. The only downfall is the cost of the the equipment but it is the most accurate method for determining power draw that is available to my knowledge. This method is what is ALREADY accepted by hard core academia but hasn't been really used by "experimenters" and "tinkerers" and most researchers into these technologies at any significant level.

    The TEKTRONIX TDS 3054C is one machine that can do it at 10,000 samples per screen per channel. Tektronix may have others at lower ranges for less money so shop around. The right equipment is needed to know what you really have in the circuit.

    Leave a comment:


  • witsend
    replied
    Hi Guys. I've been waiting for this post for about 58 hours straight - and then fell asleep at the critical moment. Have finally seen the whole thing. Well done indeed Aaron. It looks amazing.

    Could Harvey or someone please comment on the 'cooling' effect?

    Aaron needs to comment here but I understand that the multiple waveforms gives the same ballpark results. Perhaps a quick analysis? Really well done Aaron.

    EDIT Ash - just noted your comments. Who knows? Maybe charge will yet be seen to be 'wholly conserved'. Such fun. And I'm sure you all appreciate the skill in moving through those waveforms and circuit variations to find this little number. I am blown away by Aaron's talents here.
    Last edited by witsend; 08-28-2009, 03:05 AM.

    Leave a comment:


  • Harvey
    replied
    Originally posted by Joit View Post
    Nice Videos Aaron, sounds very Prof

    For the heat at the Timer i did put a Diode from Minus Timer -> Minus Source.
    It kinda helps a bit, but mine is not a fast switching Diode.
    I think the heat is caused from the negative Spikes, maybe need still again a seperate Source for the Timer.
    No, the heat is caused by not following my instructions regarding moving pin 7 to the anode of the on-time diode.

    Leave a comment:


  • Harvey
    replied
    Graphed the Data from Aarons CSV - Looks like an accurate match - No Rounding issues - ( I have the XLS file if anyone wants it)

    One thing that seems strange is the resolution drops drastically about midpoint in the cycle as can be seen in the graphs.

    Larger Pic

    Larger Pic

    Larger Pic

    Larger Pic

    Leave a comment:


  • ashtweth
    replied
    Great stuff Aaron!!! Adding now to yours/Rosie's PDF, i think we might build this one also to add beside yours, got the components ordered . Thanks a lot Aaron, its not looking good for conventional electron current theory

    Leave a comment:


  • Joit
    replied
    Nice Videos Aaron, sounds very Prof

    For the heat at the Timer i did put a Diode from Minus Timer -> Minus Source.
    It kinda helps a bit, but mine is not a fast switching Diode.
    I think the heat is caused from the negative Spikes, maybe need still again a seperate Source for the Timer.

    Leave a comment:


  • Harvey
    replied
    Well done Aaron on the single cycle analysis.

    If I understand you probe attachments, all three of them are referenced to the negative rail of the battery (aka 'ground'). Since there is only two possible wired paths for the energy to flow back into the battery (through each of the current sensing 'shunt' resistors), then using Kirchhoff's Current Law your analysis must be showing negative power consumption for this single cycle. There may be some rounding error - to help ensure this is not the case, you can set the cell type to Scientific and increase the decimal places to match the least position supplied in your data.

    Now we need to ensure that this one cycle itself is not 'riding' on a variant voltage carrier. To do this, we perform the same operation of a collection of sample cycles - say at least 100. This resolution is fine, you still have 100 samples for each cycle and that is plenty. Your method is perfect, only in this case you envelope a large group of cycles and get the average instead of the sum for the bottom line. This will help neutralize any variant baseline in the data. To discover if such a variant exists, random sample averages can be taken and compared to each other - i.e. avg for each group of 10 cycles, then each group of 25 cycles, then each group of 33 cycles. Patterns of deviation in the averages will make the variant pattern (if it exists) pop out where you can see it. An example of such a variant would be the 60 cycle hum commonly injected into to sensitive circuits by local wiring.

    Good Stuff!

    Leave a comment:


  • Aaron
    replied
    Ainslie-Murakami Negative Dominant Waveform Generator

    Here are some interesting results.

    Get these files and watch this vid:

    Ainslie-Murakami Negative Dominant Waveform Generator pdf

    Ainslie-Murakami Negative Dominant Waveform Generator
    Detailed Integrated Power Analysis
    data - .csv

    YouTube - Detailed Integrated Power Analysis of Ainslie Circuit

    The load has been up to 1.1C BELOW ambient with this circuit at these power levels - the doc says 0.8 below ambient. Please look at all above docs and videos thoroughly. The cooling effect has it's own proportionate relationship to the negative wattage running through the coils.

    There have been many other tests done but this one is quite a slap in the face of conventional electron current theory.

    ---------------------------------------------------------------


    Load waveform (more below than above)


    Tek shot of waveforms of both shunts and battery - more below than above for shunts.

    Leave a comment:


  • Aaron
    replied
    replications

    Glen & Harvey,

    Really nice to see your work!

    Leave a comment:

Working...
X