Announcement

Collapse
No announcement yet.

Mosfet Heating Circuits

Collapse
X
 
  • Filter
  • Time
  • Show
Clear All
new posts

  • #61
    Reed Relay Ignition coil 555 circuit

    [ATTACH]5410[/ATTACH]

    [ATTACH]5411[/ATTACH]

    [ATTACH]5412[/ATTACH]

    Hi all, I thought I would post these pictures of a circuit I built some time ago , as it seems relevant at the moment, and maybe someone can help me to understand it better.
    First - the breadboard shows a neat , cheap way of getting variable capacitance over a wide range. Pin2 of the 555 is connnected to the DIP switch bank -it is then possible to insert any desired capacitors , and parallel any combination of them ,to obtain any desired value. There are 7 caps in the bank here - the 8th swich was used for a variable cap ,to fine -tune the final value, but it is now soldered into another circuit.

    This circuit functions as follows : 6v battery powers 555 circuit.- output @pin3 [bottom trace of scope ], switches a reed relay.
    12v battery is in series with power limiting potentiometer, reed relay contacts ,and primary of outboard motor ignition coil
    Secondary of coil is discharged through either a spark gap alone [ can be seen glowing], or spark gap + diode. This is the top trace on the scope, and the v/division is 50v. It clearly shows that the spikes are chopped by the spark gap @75v. If the gap was not there the spikes would be over 2000v.
    The time it takes to activate the relay is clearly seen. The AC ringing is clearly seen.
    The charging of the relay coil APPEARS to be capacitative?
    The discharge of the coil is inductive, but there APPEARS to be more energy expended than input if the AC ringing is taken into account.
    I use a variation of this circuit for mosfets - so any comments will be very welcome.
    Chris

    Comment


    • #62
      Bart,

      To the contrary - my circuit is within arms reach as is the new coil I have wound

      There should be no need to try and read between any lines, the facts relating to our tests are available for everyone to evaluate. I have asked for others to evaluate them and offer their analysis but to date none have come forward with such. That request stands in perpetuity.

      Why the South African team is closed lipped with their research I can't say. All I know is that Aaron, Glen and Myself have presented Months of results for others to benefit from while we get nothing from Donny, His 'partner(s)' or the universities they are associated with regarding the testing and data gathering. Even the data from 2002 would be helpful, at least then we would know if we are truly replicating something or forging new ground. Judging from the waveforms in the patent applications, I would have to say it is the latter - but with absolutely nothing to compare it to but some vague memory of events 8 years ago who really knows? I even contacted ABB of South Carolina - they have no record of anything related to this. Perhaps I had the wrong ABB, who knows.

      So I take the view that if enough of us try this thing, surely someone will stumble on the same recipe they had in 2002 and get that huge 1700% output. It would be a shame for it to get archived with Bessler do to lack of interest. Please don't let my apathy and lack of ambition influence you. While I always keep an open mind and allow any person to present their argument to alter my perception of this reality in which we live, I must still have some evidence or sound logic to convince me to change what I know. Thus far, on this project, both have failed to materialize to my satisfaction - and many will tell you that I am rather easily persuaded.

      So, as you may be able to tell, I am in no rush as I await the results from team in South Africa and look forward to their success.

      Personally, I am not interested in making heat as there seems to be better ways to do that. But if there is extra energy in this that manifests as increased voltage in the BEMF spike, over and above that stored during the inductive charge, then I should like to identify it and put it to work. That will be my goal when and if I resume my tests. For now, I am running simulations on it to have a comparison to work against.

      Last edited by Harvey; 04-28-2010, 10:54 PM.
      "Amy Pond, there is something you need to understand, and someday your life may depend on it: I am definitely a madman with a box." ~The Doctor

      Comment


      • #63
        Hi Chris,

        Do you have a schematic of your setup? If not, we could draw one up I suppose. It would be good to get everything labeled out for ease of discussion.

        Any particulars regarding the scope would be good too - like timebase setting, AC or DC coupling, X1 or X10 etc.

        I like the capacitance switch - very handy. At most of the places I've worked in my younger years we had resistor, capacitor and inductor 'decade boxes' that made things easy.

        If Pin3 goes to the relay coil, isn't that the bottom trace in both pics?

        So the top trace is . . . the output with or without the diode?

        It would be interesting to see the primary vs. the secondary.

        Cheers!

        "Amy Pond, there is something you need to understand, and someday your life may depend on it: I am definitely a madman with a box." ~The Doctor

        Comment


        • #64
          Hi Harvey,
          Thanks for your reply, and you seem to have understood my rather confusing description of the circuit. To answer your queries :
          Yes, pin 3 is the bottom trace in both pics. Ground is 3 divisions below the center line. I always use the scope probes on x10, and state the actual voltage seen. The time /division is 1ms in both pics. I measured the wave period as 6.25 divisions, giving a frequency of 160Hz.
          The trigger selector is set to DC and both channels are DC coupled.
          The top trace has ground set at 1 division above the centre line, and is at 50v/division.It shows the output of the ignition coil secondry, with a spark gap only [in one pic], and with a fast acting diode in series with the gap [in the other pic].
          I have a pic of the primary /secondary, but both waveforms are exactly the same, except for a difference of exactly 100v. That makes this ignition coil a 100:1 step up autotransformer. I was surprised at how exactly the same the two traces are.
          I will try to get the circuit diagram done this weekend with the values as precise as I can get.
          This circuit is not vey practical - if I increase the frequency , the reed relay becomes erratic, and if I increase the power to the coil, the relay will burn out. But at this frequency, it gives me the best pictures I have ever got of the charge /discharge of an ignition coil.
          I measured the frequncy of the ringing to the best of my ability, and was surprised to find that it was 16kHz - 100 times the frequency of the waveform. Looking at the time that the spark gap is firing, on charge and discharge - they look to be the same without the diode, but there seems to be a lot of energy in the ringing as well. With the diode, there is appreciably less energy in the discharge, so the diode mut be dissipating a lot.
          When the relay contacts separate, there is a visible "shoot through" before the diode blocks the negative current, even though the diode is an MUR 140 with a 50ns reverse recovery time. Also , in this shoot through, there is a temporary reversal at about -12v. I dont understand this.
          I have to find my camera tripod and get some better pics, as the ones posted are a bit fuzzy. I will post them and the circuit diagram over the weekend. If I can get to understand this circuit it will help me a lot.
          Chris

          Comment


          • #65
            The Schematic

            Hi Chris,

            If I have the layout in my mind correctly, and looking at your pic, does this look like what you have there?

            The Ozmatic Schematic

            The Ozmatic Schematic RevA


            Last edited by Harvey; 05-01-2010, 12:17 AM.
            "Amy Pond, there is something you need to understand, and someday your life may depend on it: I am definitely a madman with a box." ~The Doctor

            Comment


            • #66
              Hi Harvey,
              I just logged in to post my schematic, and found you had already done it! - Which is great, as I am having severe trouble uploading mine - I cant get it small enough for the limits..Anyway, you got the 555 circuit spot on - amazing.
              R1 = 7.5k.
              R2 = 12k.
              cap bank = 0.3uF.
              pin 5 goes to ground via 0.01uf cap.
              R3 =1200R.
              There is an LED +7.5k resistor between pin3 and 6Vground.
              Q1 = 2N2222A,and this is where It starts to differ from what you have.The collector of the transistor is connected to 6Vcc. and the emitter goes to the relay coil through a 180R resistor.The other end of the relay coil goes to 6V ground.The 2 battery negatives are not connected [except by scope probe grounds].
              The HV circuit goes like this : 12V battery positive is connected to one of the relay contacts through a 10 watt pot set at 40R.The other relay contact goes to the primary of the ignition coil.
              12Vbattery negative is connected to the common terminal of the ignitiion coil. It also goes to the common pole of a DPST switch. One of the switching poles of this switch is connected straight to the spark gap, and the other is connected to it via a MUR140 diode [anode first].This enables the diode to be switched in and out at will.
              The other end of the spark gap is firmly connected to the ignition coil secondary. And that`s it - if you can follow it.
              When I built it -I wanted total isolation between the two circuits, but I forgot about those pesky scope grounds! I am still thinking of putting a separate ground for each channel in the scope.
              Your circuit looks interesting,but it is impossible to separate the common connections on these ignition coils- they are sealed. I might try it with a suitable transformer.
              Many thanks for your input - its very much appreciated, and it might seem off topic, but its not - and this circuit wont hurt anyone.
              Chris

              Comment


              • #67
                How's this look?

                The Ozmatic Schematic Rev A
                "Amy Pond, there is something you need to understand, and someday your life may depend on it: I am definitely a madman with a box." ~The Doctor

                Comment


                • #68
                  Ok Harvey,
                  THAT was unbeleivable - you have it exact as far as I can see.
                  Except for D1, which is something I dont understand, but suspect might be an improvement ? - You got it through my garbled explanation littered with mistakes. I would love to see a simulated waveform , to compare with the actual ones that I am getting.
                  Im going to have a drink!
                  Chris

                  Comment


                  • #69
                    Hi Chris,

                    D1 is supposed to be a voltage controlled capacitor (varicap) as far as the part specification goes, but I just slapped that in there to represent your adjustable cap. It would need another series capacitor and voltage source at the cathode to function correctly.

                    Some of the parts are not Spice ready parts (like the relay) and I would have to prep it to do a simulation. Right now I am spending my simulation time on my Big Coil when I get the urge to work on it which is not all that often.

                    If I understood you correctly, your transformer is an ignition coil. These coils are made to withstand upwards of 30,000V on the secondary. Unless you have the capacitive discharge type, the principle behind their operation is that they support a very fast field collapse in the primary when the point contacts open. This very steep change in magnetic flux produces an extremely high negative BEMF pulse in the primary with nowhere to go (right at the point contacts) and this is stepped up by 100 times by your winding ratio. So a 300 volt negative BEMF on the primary will manifest a 30,000 volt negative on the secondary and that's what jumps the .030 inch gap on the spark plug in the engine.

                    Your use of a resistor in series with the primary puts a limit to the current that can flow in the primary. This is because there is a maximum imposed due to the voltage drop across it. Even if your primary was a superconductor at zero ohms, there would be a 12V drop across the 40 ohm pot limiting the maximum current to 300mA. This directly effects the inductive charge of the primary - it may or may not be getting a full charge relative to its inductance, or how much the core can hold before it saturates and this plays a big part in how much BEMF is produced when the contacts open. This resistor also plays a part in the Impulse Response of the primary. If you look at the equation in that link you will find that Tau (1 time constant) = L / R. We usually assign 5 Time Constants (or 5 x Tau) to represent a full charge (even though, theoretically it never reaches full charge as each step is a percentage of the previous and just keeps getting smaller and smaller to an infinitesimal value) but 5 gets us to 99.99% full charge. What we see here, is that our time constants get shorter the greater the resistance. For example, let's say L = 200 and R = 40, then Tau = 5. Now lets increase R to 100 and we find that Tau drops to 2. So to put it simply, the primary of the coil responds faster with the resistor in series with it, but the overall energy is reduced (because it is spent on the resistor). That's the trade off. So you may be seeing that if you had a larger voltage source on the primary, then you could boost the energy level and get the benefit of the faster response. A 30V supply, and a 100 ohm setting on your pot would be about 9W dissipated, the current would be the same, but the charge time would be faster. Conversely, a 15V supply and a 25 ohm setting would still give about 9W dissipated in the resistor, but the energy in the spark would be greater as the current is doubled - while the impulse response suffers.

                    You may also note that the way the diode is in the schematic on the secondary, it allows the positive impulse that occurs during the relay contact closure to pass, but it attempts to block the large negative BEMF induced pulse. It is probably being pushed into its avalanche region and producing the noted 'punch through'. By turning it around, we would maximize the function of this coil, keeping the positive pulse in the core to be used in BEMF collapse, and then allowing that negative spike to conduct fully through the diode. Chances are, in that case, we wouldn't reach avalanche - I haven't looked at the specs on that diode to see what it's limits are.

                    Now to bring this on topic. To be a MOSFET Heater device, it would need a MOSFET in place of the relay, and it would need an inductive resistor somewhere - perhaps in place of the 10W Pot?

                    Now - what would happen if we ran the switch common to the inside of a isolated metal sphere instead of the battery negative? And what if we connected some CCFL tubes to the outside of that metal sphere? And then (the part I really like here) we connect the other side of the CCFL tubes to the 12V battery positive. Would we still get heat, light the lights and recharge the battery all at the same time? (Trick Question )


                    Last edited by Harvey; 05-01-2010, 09:00 AM.
                    "Amy Pond, there is something you need to understand, and someday your life may depend on it: I am definitely a madman with a box." ~The Doctor

                    Comment


                    • #70
                      Hi everyone,

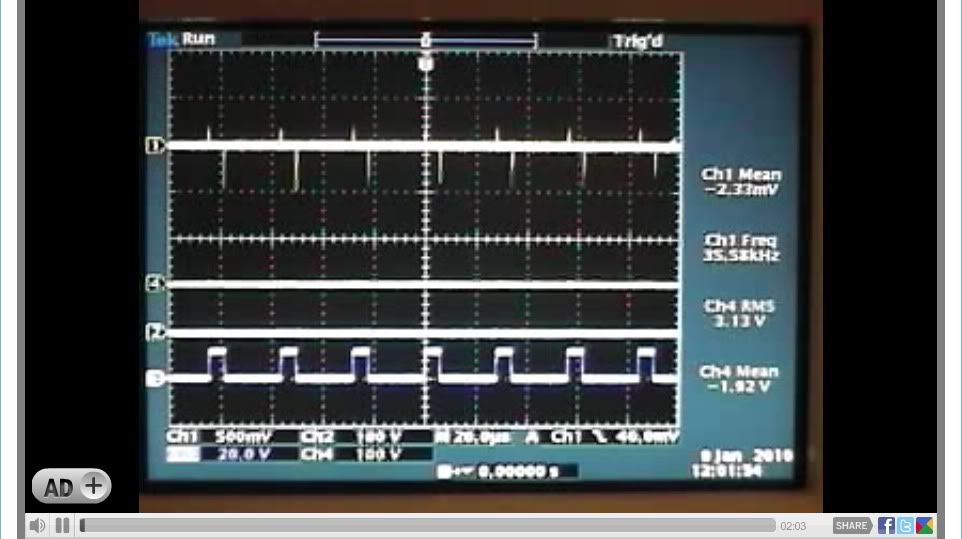
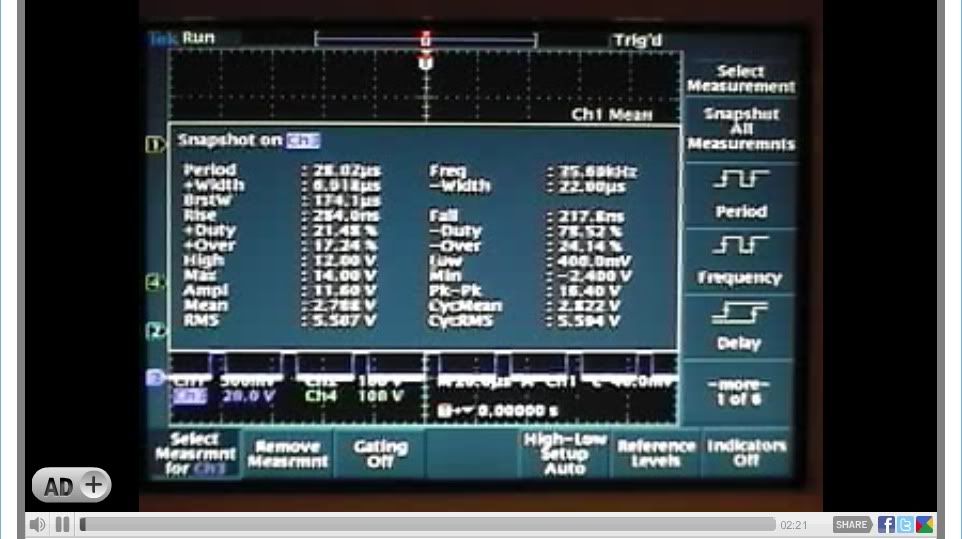
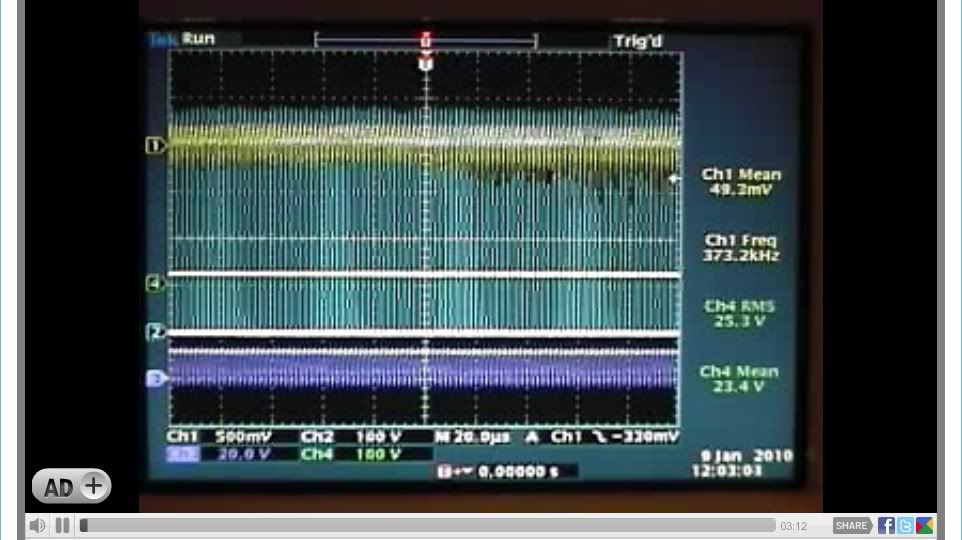
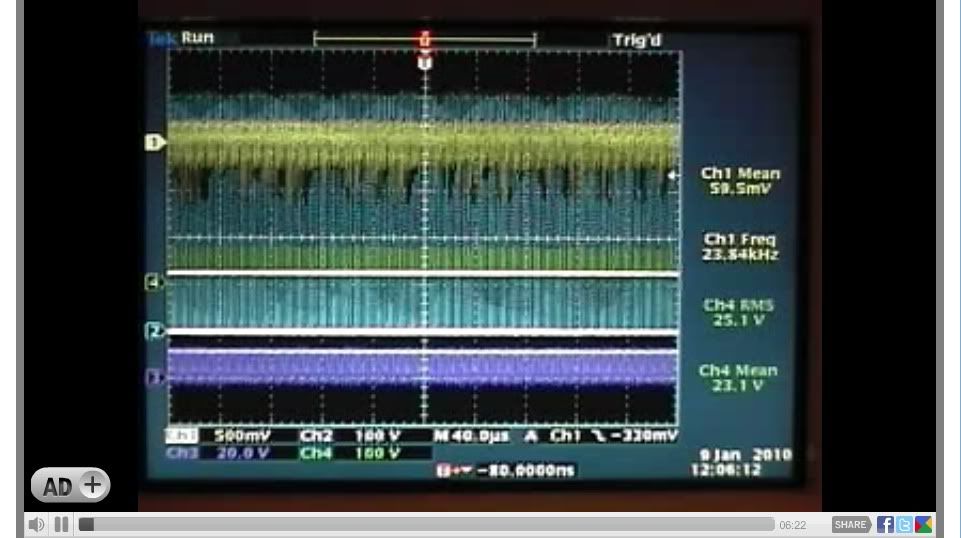
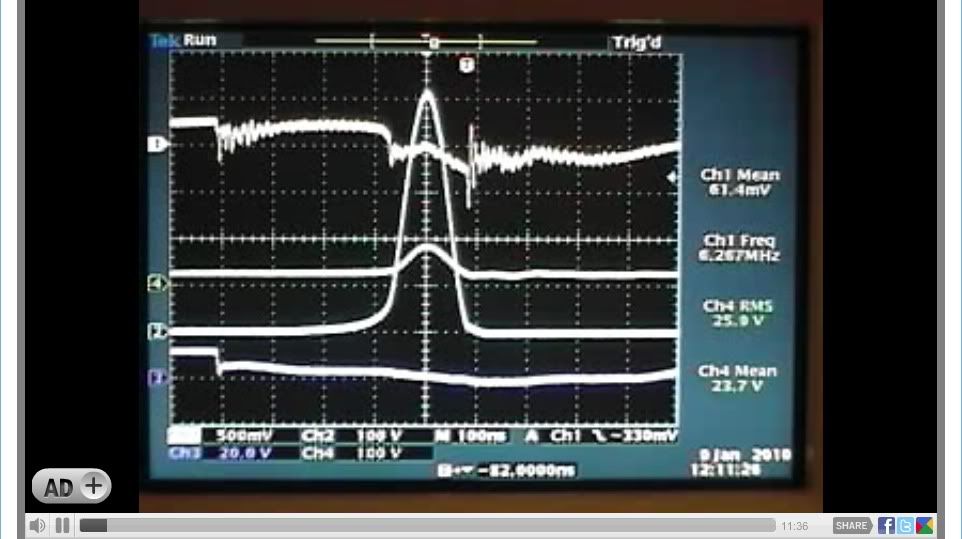
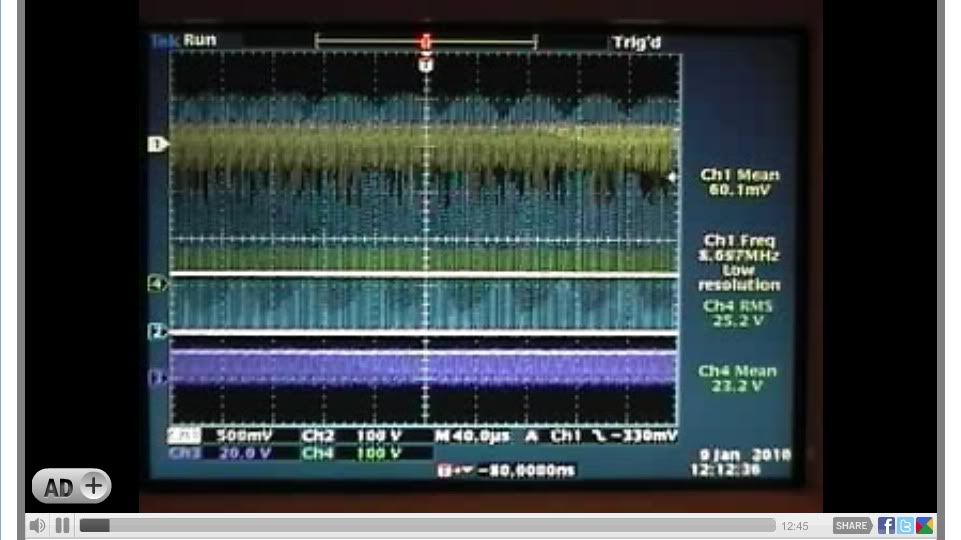
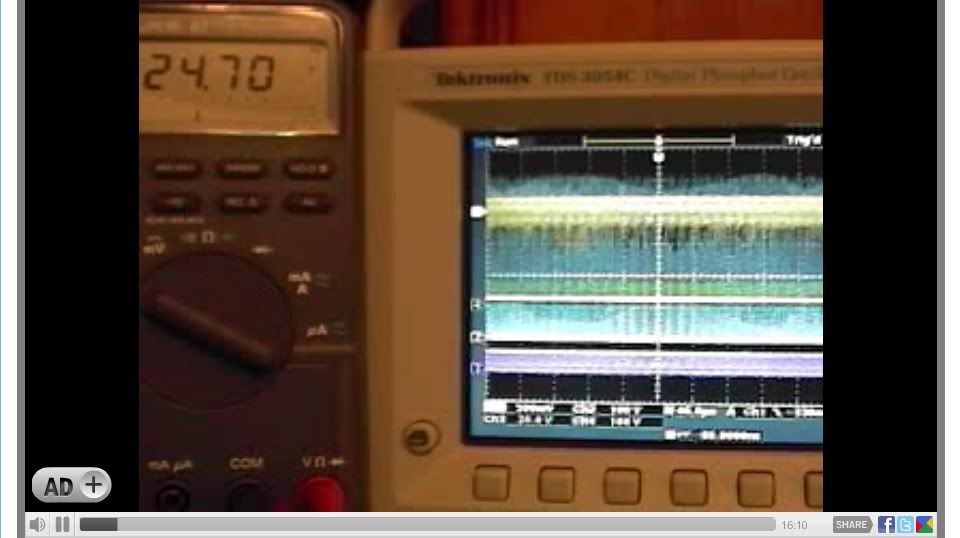
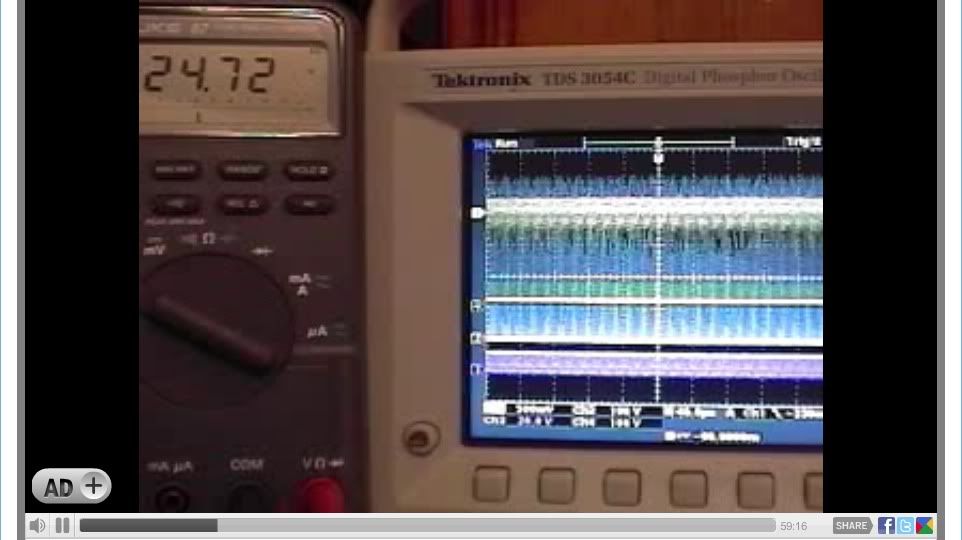
                      This post is a recap of my "LIVE" recording at "Open Source Research and Development" which is the best recorded representation of the preferred mode of operation a 5-Hour non stop video recording on January 9, 2010 using a Tektronix TDS 3054C Oscilloscope.

                      This 5 hour video recording is from a dead start after the scope calibration as all testing and evaluation of the circuit. Please see Image time bars for actual recorded times in hours, minutes and seconds.

                      Channel 1 - Mosfet Source Pin
                      Channel 2 - Mosfet Drain Pin
                      Channel 3 - 555 Timer Pin 3
                      Channel 4 - 24 Volt Battery Bank


                      Scope Trigger - Channel 1 "FALLING" signal slope [ \ ] "IMPORTANT"

                      "START"

                      First connecting the 12 Volt battery to 555 timer circuit only, adjust the "ON" potentiometer to minimum resistance (0), adjust the "OFF" potentiometer to maximum resistance (2K), resulting duty cycle is at about 21.48 %


                      Now Connecting the 24 Volt battery bank to the device circuit not touching the "ON" or "OFF" 555 timer Potentiometer again. The circuit now defaults to a 50 - 55 % duty cycle, no further "ON" or "OFF" potentiometer adjustments needed.


                      Now adjusting the "GATE" potentiometer "only" using the oscilloscopes 100ns division for minimum Mosfet source Channel -1 Mean mV from 50 to 70 and the four (4) divisions from the 555 timer "OFF" signal to the Mosfet drain or 24 Volt Battery signal "spike" combined with the Fluke 87 DMM highest voltage reading connected to the 24 volt battery bank


                      Now the double checking of the "GATE" potentiometer adjustment "only" using the oscilloscopes 100ns division for minimum Mosfet source Channel -1 Mean mV from 50 - 70 and the four (4) divisions from the 555 timer "OFF" signal to the Mosfet drain or 24 Volt Battery signal "spike" combined with the Fluke 87 DMM highest voltage reading connected to the 24 volt battery bank.


                      The Mosfet circuit is now 100 % fully functional in the preferred mode of operation and under "load" the 24 Volt Battery bank Voltage is now at 24.70 DC Volts with no further adjustment to be made on any of the circuit potentiometers.


                      A now recorded 24 Volt battery bank voltage increase seen on the Fluke 87 from the starting voltage of 24.70 to 24.72 DC volts.


                      "FINISH"

                      Now after approximately 5 Hours of continuous operation the 24 Volt battery bank voltage has dropped from the starting voltage of 24.70 to 24.59 Volts DC, a total decrease of .11 Volts DC , maintaining a constant 140 to 145 + degree F temperature on the "Load Resistor" which is about 5.5 watts continuous load.


                      Best Regards,
                      Glen
                      Last edited by FuzzyTomCat; 05-04-2010, 01:47 AM. Reason: better clearity
                      Open Source Experimentalist
                      Open Source Research and Development

                      Comment


                      • #71
                        Nice overview

                        Glen, thanks for taking the effort again to post all this. I immediately see one big difference compared to what I did. I have everything connected at once, so the 24V battery on the load too. You do some initial settings on the 555 'before' you connect the 24V battery to the load and you don’t even adjust the ON/OFF pots anymore afterwards, only the gate-pot. Ok, I will give it another try tomorrow.

                        Cheers,
                        Bart

                        Comment


                        • #72
                          Thanks Glen,

                          As always I am impressed by your work

                          I was trying to do some basic calculations on how long your two batteries can sustain a 5.5 watt load. I come up with about 104 hours, does that sound right? They are each 12Ah batteries so there is 24Ah of charge in them. A basic DC breakdown is 5.5W / 24V = 0.229A. 24Ah / 0.229A = 104 hours.

                          So all we need to do now is run for more than 104 hours on those batteries and we have pretty good proof that we have extra energy coming from somewhere else And that's not even counting the lost energy in MOSFET or CSR to heat. Good Stuff!

                          ETA: Oh, I almost forgot - if we conclude that those Gel-Cell (edit: wait, those or Liquid Acid?) batteries are discharged when they reach 10V each, then that would be a drop of 4V over the 104 hours. That would give us a 0.0385V (38.5mV) drop per hour. So for the 5 hours we would have expected a minimum of 193mV drop not counting the energy spent on the MOSFET and CSR. Our results show only 110mV drop in that time frame, 83mV short of the linear projection. So you can see why we think we are getting energy from somewhere. Either that, or our battery discharge is not linear And BTW, it only gets better for us if we conclude the battery voltage should be lower than 10V when discharged (of course we all know that the battery voltage needs to be measured under specific load conditions)

                          Last edited by Harvey; 05-02-2010, 03:44 AM.
                          "Amy Pond, there is something you need to understand, and someday your life may depend on it: I am definitely a madman with a box." ~The Doctor

                          Comment


                          • #73
                            Originally posted by b4FreeEnergy View Post
                            Glen, thanks for taking the effort again to post all this. I immediately see one big difference compared to what I did. I have everything connected at once, so the 24V battery on the load too. You do some initial settings on the 555 'before' you connect the 24V battery to the load and you don’t even adjust the ON/OFF pots anymore afterwards, only the gate-pot. Ok, I will give it another try tomorrow.

                            Cheers,
                            Bart
                            Hi Bart,

                            I'm glad you liked the information on the January 9, 2010 video recording and you can find it useful.

                            My hope is this will help you and other replicators to visually see whats happening with this simple experimental device that operates so complex.

                            Glen
                            Open Source Experimentalist
                            Open Source Research and Development

                            Comment


                            • #74
                              Originally posted by Harvey View Post
                              Thanks Glen,

                              As always I am impressed by your work

                              I was trying to do some basic calculations on how long your two batteries can sustain a 5.5 watt load. I come up with about 104 hours, does that sound right? They are each 12Ah batteries so there is 24Ah of charge in them. A basic DC breakdown is 5.5W / 24V = 0.229A. 24Ah / 0.229A = 104 hours.

                              So all we need to do now is run for more than 104 hours on those batteries and we have pretty good proof that we have extra energy coming from somewhere else And that's not even counting the lost energy in MOSFET or CSR to heat. Good Stuff!

                              ETA: Oh, I almost forgot - if we conclude that those Gel-Cell (edit: wait, those or Liquid Acid?) batteries are discharged when they reach 10V each, then that would be a drop of 4V over the 104 hours. That would give us a 0.0385V (38.5mV) drop per hour. So for the 5 hours we would have expected a minimum of 193mV drop not counting the energy spent on the MOSFET and CSR. Our results show only 110mV drop in that time frame, 83mV short of the linear projection. So you can see why we think we are getting energy from somewhere. Either that, or our battery discharge is not linear And BTW, it only gets better for us if we conclude the battery voltage should be lower than 10V when discharged (of course we all know that the battery voltage needs to be measured under specific load conditions)

                              Hey Harvey,

                              I'm sorry it took so long to do a detailed overview of the "LIVE" broadcast I did in the "Open Source Research and Development" channel on the January 9, 2010 5 Hour non stop video recording.

                              This video as you are aware is one of the best ever recorded representation of the preferred mode of operation but only in a non stop 5 Hour video. I'm sure that many members and guests don't realize the difficulty in capturing this effect for the purpose of recording the data properly and if given the time looking at the recorded video everyone can see the problems that we face in getting accurate data.

                              The constant 24 volt battery bank voltage fluctuations going up and down the Mosfet "drain" spike oscillating from 500 to 900 volts, battery voltage down the Mosfet spikes, battery voltage up the Mosfet voltage to normal operating range, back and forth over and over.

                              I have tried to get as close to this mode of operation in Test #13 which was used in the IEEE submittal Open Source Evaluation of Power Transients Generated to Improve Performance Coefficient of Resistive Heating Systems the team including yourself did, and in Test #22 but never being able to record the data scientifically correct because of the circuits complex oscillating waveforms. I don't think everyone, members and guests understands that the Test #13 was done with a Tektronix TDS 3054C which has a maximum resolution of 10K of data spread over a 10 x 10 grid or divisions so each one has 1k of data samples separately for each of the 4 channels. The data collected in Test #22 was with a Tektronix DPO 3054 which has a maximum resolution of 5M of data, but I used the 100K which is spread over the same 10 x 10 grid or divisions so each one has 10k of data samples separately for each of the 4 channels ..... ten ( 10 ) times the data of the TDS 3054C used in Test #13.

                              The problem being we need to find a method of capturing the data continuously in real time, there's nothing wrong with Tektronix TDS 3054C or the DPO 3054 these are the finest instruments I've ever used and are extremely accurate, but if you push the acquire button at the wrong time you can appear to get conflicting or skewed data, not the case .... were you before the spike, during the spike or after the spike when the data was collected. I had a allotted dedicated set time to record the data, It was the time frame I used with the 6 minutes or as fast as the data could be physically collected with the finest equipment I had at my disposal.

                              I am in total agreement with you that something "good" is happening in the Mosfet Heating Circuit and can be plainly seen in the recorded videos, we just need to somehow get a streaming real time data recording. Maybe by somehow obtaining a Real-Time Spectrum Analyzers from Tektronix or some other method to verify the data findings as you suggested, the equipment I previously used as good as it is, just isn't enough to totally capture what is occurring during the preferred mode of operation.

                              Best Regards,
                              Glen
                              Open Source Experimentalist
                              Open Source Research and Development

                              Comment


                              • #75
                                Back To Basics Part 2 : The First Half Of The Transaction

                                I'll bet you thought I was going to leave you all hanging with my questions in this post:

                                http://www.energeticforum.com/induct...html#post93202

                                Nah, I wouldn't do that to you guys so here come the answers:

                                Here are some questions to answer regarding Test #13:

                                What is the frequency?
                                That depends on what part of the circuit we look at. But generally we use the gate pulse frequency:

                                426.0 kHz
                                Rise 768.4ns
                                Fall 513.0ns
                                High 13.61V
                                Low -4.800V

                                What is the impedance of the load resistor?
                                The classical formula for impedance of an RL circuit is Z = √ R² + X²

                                R = 9.73
                                X = 2πfL
                                2π = 6.28
                                f = 426000

                                Now for L we need to determine the inductance in Henries:

                                The formula for inductance of a single coil winding in microhenries is (r²N²/9r+10l) (For reference, one inch = 25.4mm)
                                r = (32mm / 2) / 25.4 = 0.625"
                                N = 48, the number of windings
                                l = length of all the windings and spacing. 20 AWG = 0.032" = 0.8128mm thick, so the length = (48 * 0.8128mm + 47* 1mm)/25.4 = 3.39"

                                So, L in Henries = ((0.625² * 48²) / ((9 * .625) + (10 * 3.39))) * 10^-6 = ((0.390625 * 2304) / (5.625) + (33.9))*10^-6 = (900/39.525)*10^-6 = 0.00002277H

                                So, X = 6.28 * 426000 * 0.00002277 = 60.92Ω (That is the inductive reactance of Glen's resistor at that frequency)

                                So, Z = √ (9.73² + 60.92²) = 61.69Ω

                                With this information we can also determine the Phase Angle of the current in this inductive resistor using the formula: θ = arctan(X/R). For Glen's resistor, we expect the current to lag the voltage by 80.92°

                                What is the real power being dissipated? P = I²R | I = E/Z | E = (24.77 / (Z + 2 + 0.25))* Z = 23.90V
                                So, I = 23.90 / 61.69 = 387mA. Thus the real power dissipated is 1.46W

                                What is the apparent power involved, yet returned? P = I²X
                                So, 387mA² * 60.92Ω = 9.14 volt-amps. ( I added this question here)

                                How does a square wave affect the impedance of an inductor? This was a trick question - Inductors do not have impedance unless coupled with capacitance or resistance. However, inductors do have impulse response and reactance, both of which can be affected by the slope of the waveform. This was introduced here to get people to understand that there is more happening here than even a basic classical AC approach can address. The risetime and falltime of the waveforms associated with the inductive-resistor play an important role in the actual instantaneous reactance.

                                If the resistor was non-inductive, would the frequency make any difference as long as the duty cycle remained constant? No, the power relationships remain the same regardless of frequency as long as the duty cycle remains constant in purely resistive applications.

                                ================================================

                                So when is power delivered from the battery to the load?
                                This is when the gate pulse is at a positve voltage relative to the MOSFET source pin. Note that there is a low voltage reading of negative 4.8V on the gate pin. We don't have the MOSFET Source pin value recorded in the screen shot to go with that, but we do have the data dumps and we could look up what the source reading was when the gate was at that level. This may be an interesting exercise for you to do as it can enlighten you as to how a 555 timer can allow a negative voltage to occur on the output pin 3 and where that negative energy comes from.

                                We find then, that when we apply the classical AC (or pulsed DC) treatment to Glen's Test #13, we expect to see a power dissipation of 1.46W and an overall power swing around 10.6W which is mostly apparent power. This is much closer to what the actual data showed, with a true average of 1.3W when we include the high resolution 2µS/div data, with the lower resolution 40µS/div data. Each of these samples were averaged independently, and then all of those averages were averaged together to reach 1.3W. That is about as true as we could get considering the entire test covered a full hour and we only have 0.00462 seconds (4.62ms)of data for the entire test. A lot can happen in the other 3599.99538 seconds we have no data for. Sure would be nice to have an RSA6000 to get some seamless data with.

                                Now this puts us back to asking the question: If we are only showing, both by projections and by data, ~1.5W of dissipation, how do we account for the 5.5W of thermal output?

                                Last edited by Harvey; 05-04-2010, 06:45 AM.
                                "Amy Pond, there is something you need to understand, and someday your life may depend on it: I am definitely a madman with a box." ~The Doctor

                                Comment

                                Working...
                                X